Who can explain this slide for me!?

Who can explain this slide for me!?

Induction is bottom up approach to reasoning, proceeding from specific observations to general explanations.
Deduction goes the other way: from general to specific.
All methods of doing science use both inductive and deductive reasoning, but the emphasis that they receive differs.


Consider a dataset of femoral head diameters from male and female baboons.
Make a boxplot of FHD by sex with points overlaid on the boxes.

The null hypothesis is the simplest possible explanation for a phenomenon. This explanation is usually that random variation is responsible for any apparent pattern.
Question: In the case of our baboons, what is the null hypothesis?
Next, we create one or more statistical alternative hypotheses.
Alternative = difference between male and female femoral head diameters is too great to be accounted for by chance alone.
Most of the time, we don’t explicitly specify the alternative, we just suffice it so say that the alternative is “not \(H_0\)”
The alternative hypothesis is focused on the pattern in the data…not the cause of it.
In terms of conditional probability, the p value represents
\[ P(Data\ |\ H_0) \]
For baboons, we might use a T-test to compare means.
Like all parametric statistics, the T-test returns a test statistic.
Because we are assuming that the null hypothesis is true for the moment, we can compute an expected T distribution.


Which R function would tell me the cumulative amount of probably density in this distribution up to our observed value?
Our T-test would return a very low p value.
Highly unlikely to get two sex groups with means as different as ours, if the variation was attributable only to chance. We know this because we know the distribution of the T statistic when the null hypothesis if true.
The p-value is an estimate of how likely our data are, assuming the null hypothesis is true.
Low p values do not mean the alternative hypothesis has been proven.
| The Truth | Retain \(H_0\) | Reject \(H_0\) |
|---|---|---|
| \(H_0\) True | Correct! | Type I error (\(\alpha\)) |
| \(H_0\) False | Type II error (\(\beta\)) | Correct! |

Which type of error is worse?
Statistical power is related to Type II errors, and is calculated as \(1 - \beta\).
This tells us how likely we are to detect an effect when one actually exists.
Before starting a study it is worth doing a power analysis to determine the rate at which an effect of a given size will be detected with a given sample size.
The risk of Type I and Type II error rates are inversely related to one other.
This relationship is not simple, though. Type II error rates depend on a lot of things, like the sample size and strength of the effect.
Given very large sample sizes, the risk of Type II errors is low, but this also means the risk of Type I errors is high.
Tiny, virtually meaningless differences can become statistically significant.
When you find statistical significance, you have to ask

Don’t be a blind follower of \(p<0.05\) !!!!!
p-values don’t measure effect size!!!!
Many bacon lovers learned difference between effect size and significance a couple of years ago…

We will walk through testing the same hypothesis in all three frameworks
Ant data from Gotelli CH 5
Read this data into R yourself!
Lets test the hypothesis that habitat type influences ant distributions. Based on this hypothesis, we would expect that the number of ant nests in forests differs from the number of ant nests in fields.
What is the null hypothesis here?

Town of Monte Carlo
Monte Carlo refers to a world-famous casino, in a town on the French Riviera (in the Principality of Monaco).
In Monte Carlo analysis, data are randomly reshuffled over and over to specify the null hypothesis, and these reshufflings are compared against the observed data.
There are four steps:
We will use the absolute value of the difference in group means. We will need to calculate this over and over, so we will make a function to do it.
abs.mean <- function(df){
  library(dplyr)
  means <-
    df %>%
    group_by(Habitat) %>%
    summarize(meanAnts = mean(n_Ants))
  return(
    abs(means$meanAnts[1] - means$meanAnts[2])
    )
}

abs.mean(ants)
## [1] 3.75
Now, we reshuffle the ant nest counts with the sample() function. Note: by default, the function draws a sample of the same size as the original vector, without replacement.
ants$n_Ants
## [1] 9 6 4 6 7 10 12 9 12 10
sample(ants$n_Ants)
## [1] 12 7 6 10 9 10 9 4 12 6
We can do this 1000 times by using a for loop
results <- numeric(1000)

for(i in 1:1000) {

  mix <- ants
  mix$n_Ants <- sample(mix$n_Ants)
  results[i] <- abs.mean(mix)
}
We can look at the results with a histogram


When we compute the p value, we will ask how many mean differences computed on the randomized data are as extreme or more extreme compared to our observed mean difference. This is known as the tail probability.
Should we look at just one side of the distribution or both?
We are looking at the absolute value, of the difference, so we want a 1 tailed test.
To get our 1-tailed p-value, we just count up how many of the mean differences in the randomized data are as big as (or bigger than) our observed mean difference (3.75).
count_extreme_diffs <- sum(results >= 3.75)
count_extreme_diffs / 1000
## [1] 0.034
Shortcut…
mean(results >= 3.75)
## [1] 0.034
for a ★ who can explain how this works?
What does our p value of 0.034 mean?
If there is no relationship between habitat and and nest count, we would expect to observe data with a mean difference as extreme or more extreme than ours about 3.4% of the time.
The p-value is an estimate of how likely our data are, assuming the null hypothesis is true.
Low p values do not mean the alternative hypothesis has been proven.
Pros:
Cons:
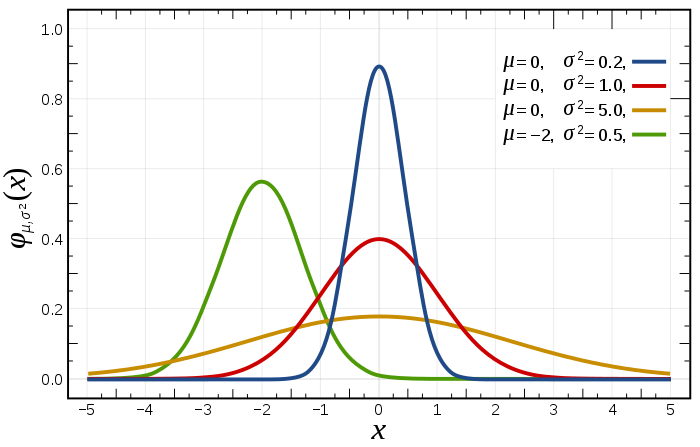
Assumes data were sampled from a specified distribution (usually normal distribution).
Parameters of this distribution used to calculate tail probabilities data given a null hypothesis.
\[P(data\ |\ hypothesis)\]
Which R function computes tail (i.e. cumulative) probability for the normal distribution?
dnorm()?
pnorm()?
qnorm()?
rnorm()?
F statistic or F ratio - useful for comparing whether group means differ
Basis for ANOVA
\[ F = \frac{(variance\ between\ groups + variance\ within\ groups)}{variance\ within\ groups}\]
We will spend a lot of time talking about how to calculate the F ratio
Our F-ratio in the case of the ant nests is
\[ F = 33.75 / 3.84 = 8.78 \]
The null hypothesis is data were drawn from single population.
If true, then our F ratio tends to be about 1 (similar variance between and within groups)
Larger and larger values of F are less and less likely to be observed under the null hypothesis.
The F statistic follows a known F distribution.


The upper tail probability can be computed easily because we are dealing with a known distribution.
1 - pf(8.78, df1=1, df2=8)
## [1] 0.0180603
For another ★
Who can tell me what this p-value of 0.018 means?
The p-value is an estimate of how likely our data are, assuming the null hypothesis is true.
Low p values do not mean the alternative hypothesis has been proven.
Pros
Cons
Bayes’ theorem discovered by Rev. Thomas Bayes in the mid-18th century
Based on inverse probability
\[P(hypothesis\ |\ data) = \frac{P(hypothesis) * P(data\ |\ hypothesis)}{P(data)}\]
\[Posterior\ Probability = \frac{Prior\ Probability * Likelihood}{Marginal\ Likelihood}\]
Turns the question around compared to parametric. Considering our ants:
Parametric asks: \[P(F_{obs} = 8.78\ |\ F_{theoretical})\]
Bayesian asks: \[P(F\geq5.32\ |\ F_{obs} = 8.78)\]
Note: 5.32 is the critical value from this F distribution, used to mathematically specify alternative hypothesis.
Specify parameters as random variables, instead of assuming there is a single fixed (but unknown) value of parameters
So the mean of the ants in the field would be: \[ \mu_{field} \sim N(\lambda_{field}, \sigma^2)\]
\[Posterior\ Probability = \frac{Prior\ Probability * Likelihood}{Marginal\ Likelihood}\]
What are the expected probability distributions for our parameters before we do the experiment?
Can either use uninformative flat priors, or base them off of our previous knowledge about ant colony densities in field and forest.

Incorporating prior knowledge into hypothesis testing is fundamental distinction
Next we estimate the likelihood.
\[Posterior\ Probability = \frac{Prior\ Probability * Likelihood}{Marginal\ Likelihood}\]
The standard probability \(P(data\ |\ hypothesis)\) is the probability of our data given the null hypothesis.
Likelihood is proportional to probability, but:
\[Posterior\ Probability = \frac{Prior\ Probability * Likelihood}{Marginal\ Likelihood}\]
Now we just do the math to calculate the posterior distributions for our parameters. We can then use Monte Carlo to produce an expected distribution of F value with our posterior values.

Tail probability of observed F in our simulated F distribution is P = 0.67
Much higher than our parametric or Monte Carlo estimates
Would change if we used different priors
Pros
Cons
Most of what you do will be parametric stats: be sure to think about assumptions
Be very careful about \(\ p < 0.05\)
Bayesian offers a powerful (if complicated) alternative
Monte Carlo is flexible and awesome, and you should do it!